 Portal
Analysis on Foreign Workers and Enterprises under EPS
Page 1 of 1
![]()
 Analysis on Foreign Workers and Enterprises under EPS
![]() by dave Wed Mar 12, 2008 1:31 pm
by dave Wed Mar 12, 2008 1:31 pm
1. Trend of Foreign Workforce

As shown in (Table 3) of foreign workers by sending country, the number of Vietnamese workers is the largest, followed by the Philippines, Thailand, Mongolia, Indonesia, and Sri Lanka. For ethnic Koreans, Korean Chinese are dominant with 99.8%.

2. Features of Foreign Workers under EPS

3. Industries and Business Size of Enterprises Hiring Foreign Workers
4. Wage, Working hours and Productivity of Foreign Workers


Foreigners started to work in Korea in late 1980's, usually engaged in so-call "3-D" jobs. As of April 2007, they are as many as 410,000.
The number of foreign workers who found a job in Korea after implementation of EPS from 2004 to May 2007 is 162,193 as shown in (Table 2). Among them, the numbers of general foreign workers with E-9 visa were 73,036 (45.0%) and that of ethnic Koreans with F-1 Visit Cohabitation Visa or H-2 Visit Employment visa (since 2007) was 89,157 (55.0%).
The number of foreign workers who found a job in Korea after implementation of EPS from 2004 to May 2007 is 162,193 as shown in (Table 2). Among them, the numbers of general foreign workers with E-9 visa were 73,036 (45.0%) and that of ethnic Koreans with F-1 Visit Cohabitation Visa or H-2 Visit Employment visa (since 2007) was 89,157 (55.0%).
As shown in (Table 3) of foreign workers by sending country, the number of Vietnamese workers is the largest, followed by the Philippines, Thailand, Mongolia, Indonesia, and Sri Lanka. For ethnic Koreans, Korean Chinese are dominant with 99.8%.
2. Features of Foreign Workers under EPS
As shown in (Table 4), the labor constitutions of foreign workers and ethnic Koreans under EPS are very different.
First, for sex proportion, man accounts for 87.9%, taking dominant majority among foreign workers under EPS. However, in the case of ethnic Koreans under EPS, woman takes up 37.6%, which is quite high compared to foreign workers under EPS.
For marital status, 65.8% of foreigners under EPS are single but 94.3% of ethnic Koreans are married. For age distribution, average age for foreign workers is 29.7 years old, which is quite young, compared to 45.0 years old of ethnic Koreans.
When it comes to educational background, 59.1% of foreign workers finished high school and 20.9% have graduated from more than junior college, which means 80.0% of the total foreign workers have more than high school diploma. On the contrary, only 51.2 % of ethnic Koreans working under EPS have more than high school diploma (high school: 45.5%, junior college and higher: 5.7%).
According to the survey on foreign workers, 68.0% of them had job experiences in their home countries before entering Korea. Those with experiences in manufacturing industry were the highest as 43.1% and service industry were 15.2%. Based on occupational types, manual jobs were the highest with 30.4% followed by service and sales (21.1%) and skilled jobs (19.6%). Their average wage in their previous jobs was USD 187.1. Wage levels are different depending on per capita GNP of each country and job distribution proportion of the sample workers but Philippine workers' wage was the highest with USD 259.2 and those of Vietnamese and Korean Chinese were comparatively low.
3. Industries and Business Size of Enterprises Hiring Foreign Workers
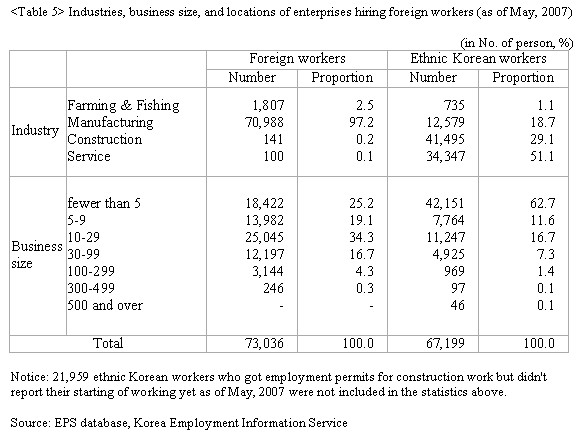
Regarding industries of foreign workers under EPS, 97.2% are employed in the manufacturing as shown in (Table 5). However, in the case of Koreans with a foreign nationality, 51.1% are in service and 29.1% in construction.
When it comes to the size of business, most foreign workers are employed at small-sized companies with fewer than thirty workers. For foreign workers, 34.3% are hired by companies with ten to twenty-nine workers and 78.6 % of the total foreign workers are employed by businesses with fewer than thirty workers. In comparison, 91% of ethnic Korean workers are employed by small-sized enterprises with fewer than thirty workers and among them, 62.7 % are hired by businesses with fewer than five workers. This high percentage of ethnic Koreans is because of the characteristics of the businesses hiring them.
When it comes to the size of business, most foreign workers are employed at small-sized companies with fewer than thirty workers. For foreign workers, 34.3% are hired by companies with ten to twenty-nine workers and 78.6 % of the total foreign workers are employed by businesses with fewer than thirty workers. In comparison, 91% of ethnic Korean workers are employed by small-sized enterprises with fewer than thirty workers and among them, 62.7 % are hired by businesses with fewer than five workers. This high percentage of ethnic Koreans is because of the characteristics of the businesses hiring them.
4. Wage, Working hours and Productivity of Foreign Workers
According to an analysis of EPS database on expected wage, which migrant workers are required to write down when they are listed on the job roster, foreign workers want KRW 750,000 but ethnic Koreans want KRW 1.24 million.
Monthly wage for foreign workers on the standard labor contract at the time when their actual labor contract was signed is KRW 710,000, slightly lower compared to their expected wage of KRW 750,000. However, for ethnic Korean workers, their monthly wage is KRW 1.19 million, which is nearly the same as their expected wage of KRW 1.2 million (refer to Table 6). When considered based on the entrance year, monthly wage for foreign workers in 2004 was KRW 697,000, which increased by 10.5% to KRW 770,000 in 2007.
On the contrary, monthly wage for ethnic Korean workers decreased by 26.4% from KRW 1,231,000 in 2004 to KRW 906,000 in 2007. The decline in wage is probably because 66.2% of the ethnic Korean workers in 2007 got a job in the manufacturing, of which wage level is lower than that of service or construction industries. When wage is compared based on industry, that of construction was KRW 1,889,000, much higher than KRW 769,000 of the manufacturing industry in 2006. When considered based on the size of business, wages of small businesses were relatively high.
(Table 7) shows migrant workers' wage, working hours, and labor productivity under EPS. If the working hour of a domestic Korean worker is 100 at the same enterprise that of migrant workers is 106.6 hours, which means a working hour gap between domestic Korean workers and migrant workers has almost disappeared.
Labor productivity of foreign workers is 89.0% that of domestic Korean workers while their wage level is 86.7%. Given all these factors, the total labor cost of foreign workers is 90.1% of that of domestic workers. This means wage gap between domestic Koreans and foreign workers does not exist when productivity is taken into account.
As shown in Table 8, if wage and labor productivity of a domestic Korean worker at the same enterprise is considered 100, those of foreign workers who do similar jobs are both on the upward trend. However, the gap in the total labor cost including lodging cost and labor productivity does not exist between domestic workers and foreign workers, according to the survey.

dave- FEWA - Administrative Adviser

- Number of posts : 1567
Location : Incheon, South Korea
Cellphone no. : 010-9294-4365
Reputation : 40
Points : 2299
Registration date : 11/02/2008
![]()
![]()
![]()

 Similar topics
» Employment of Foreign Workers Act, "Foreign Workforce Policy Committee
» Re-entry system for committed workers receives positive response from firms and foreign workers with 1,235 employment permits issued in its first month
» ACT ON FOREIGN WORKERS...
» <This year''s Quota for Foreign Workers
» Procedures Simplified for Rehiring Foreign Workers
» Re-entry system for committed workers receives positive response from firms and foreign workers with 1,235 employment permits issued in its first month
» ACT ON FOREIGN WORKERS...
» <This year''s Quota for Foreign Workers
» Procedures Simplified for Rehiring Foreign Workers
Page 1 of 1
Permissions in this forum:
You cannot reply to topics in this forum
» MAGTANONG KAY ATTORNEY....FREE LEGAL ADVICE AND ILLEGAL ADVICE
» Komento ng mga nagtake ng exam ng cbt3.?
» Para po sa mga Voluntary Returnee na nag CBT 2016
» Nagbabalik si UISHIRO
» SEVERANCE PAY PROBLEM
» what are the procedures or steps after passing the eps klt exam?
» 13th KLT PBT exam
» sa mga x korean
» Para sa mga sincere...
» medical ng sincere
» ANG DATING DAAN MASS INDOCTRINATION
» HELLO TO EVERYONE
» voluntary exit(dating TNT)
» _DAEGU_.....
» PBT CBT TEST RESULT
» List of Job Center in Seoul Area
» Guide flow para sa mga 1st timer na KLT Applicants.
» Mga mahalagang impormasyon para sa mga nais magtrabaho bilang Factory workers under EPS SYSTEM sa South Korea.
» Para sa mga Magbabakasyon sa Pilipinas
» musta na mga kasulyap specially batch 2010?
» RELEASED EPS workers
» reviewer para sa cbt 3
» looking for a job
» E-7 GROUP!!!
» REMINERS TO ALL NEW TOPIK PASSERS
» List of 12th EPS-TOPIK Passers
» Ang pagbabalik
» MEMBERSHIP
» Magkano po ang pwedeng dalhin pag uwi?
» PAALALA PO SA MGA KA SULYAP>>>>>MUST READ!!!
» SULYAPINOY 1ST ANNIVERSARY VIDEO
» Korean, Japanes,Chinese Language Auditors (Data Analysts) hiring in Concur, Philippines
» nice to be back after 2 years
» Pahelp poNeed work ko po sa daimaru
» job for female
» PARA SA MGA BABAE NA WALA PANG EPI AT NO DATA= DITO KAYO
» sa lahat ng babae na nagtatanong kung MAY PAG-ASA PA BA SILANG MASELECT EH EXPIRED NA VALIDITY NG EXAM
» Sa mga nakaka-alam,pano po ang ginawa ninyo if na hold sa immigration at nblacklisted?
» CCVI REJECTED/CANCELLED